A CONTROLLED EMPIRICAL STUDY

ToolRCA

Which tools help an RCA agent,
and when?

Rethinking Tool Design for Agentic RCA: A Controlled Empirical Study

RCA tool design lacks controlled evidence. We compare what tools analyze, which combinations help, and how agents use the results across models and systems.

375 RE1 failure cases · 3 microservice systems. Findings depend on the tested models and configurations. Study coverage

Yu Luo1, Rongchen Gao1, Zhenhui Zhou1, Changchang Liu1, Yuliang You1, Yongqian Sun1,*, Shenglin Zhang1, Qiuai Fu2, Shijie Wang2, Dan Pei3

  • 1 Nankai University
  • 2 Huawei Technologies Co., Ltd.
  • 3 Tsinghua University

* Corresponding author: Yongqian Sun

01 / A REPORTED DECISION FAILURE

The tool found the cause.
The agent changed its mind.

The mistake is not seeing an anomaly. It is treating that anomaly as a cause.

Follow the agent's available observations, its interpretation, and a separate reasoning check. The benchmark label is revealed only after the decision. Checks explain the inference; they are not verbatim agent thoughts.

Two different kinds of help: evidence-analysis tools (L2) identify unusual metrics; diagnostic tools (L3) rank possible root causes. An anomaly ranking is not a cause ranking.

01 / Incident

Two services. An unresolved diagnosis.

AVAILABLE OBSERVATIONS

A Train Ticket investigation

The reported investigation examines ts-auth-service and the payment service. The true faulty service and fault type are not shown to the agent here.

Agent interpretation · summary
The diagnosis is open. No candidate has yet been ranked in this summary.
Reasoning check · reader analysis
Keep the agent's observations separate from the benchmark label, which is revealed after the decision.
CANDIDATE & DECISION

ts-auth-service

Not yet ranked

Payment service

Not yet ranked

Investigation open

A summary of the reported case, not a raw tool transcript. The reasoning checks are explanatory commentary on this page.

THE INFERENCE TO CHECK

No CPU or memory anomaly does not rule out a delay fault.

A prominent anomaly elsewhere is not enough to replace a candidate. A sound revision needs evidence that supports the new cause and distinguishes it from the old explanation. This does not mean always trusting L3.

Complete case summary and source
  1. Two services. An unresolved diagnosis.

    Available observations
    The reported investigation examines ts-auth-service and the payment service. The true faulty service and fault type are not shown to the agent here.
    Agent interpretation · summary
    The diagnosis is open. No candidate has yet been ranked in this summary.
    Reasoning check · reader analysis
    Keep the agent's observations separate from the benchmark label, which is revealed after the decision.
  2. L3 ranks auth first.

    Available observations
    The diagnostic tool ranks ts-auth-service as the top root cause candidate.
    Agent interpretation · summary
    Auth is the current leading recommendation; payment is not the top L3 candidate.
    Reasoning check · reader analysis
    A candidate ranking is a hypothesis to assess, not ground truth. Any revision still needs relevant evidence.
  3. L2 highlights payment memory.

    Available observations
    Candidate filtering ranks a memory metric of the payment service highest.
    Agent interpretation · summary
    The agent now has a prominent payment anomaly alongside the auth recommendation.
    Reasoning check · reader analysis
    An anomaly ranking answers where a signal is unusual. It does not establish which service caused the incident.
  4. Missing symptoms become a reason to reject.

    Available observations
    The agent finds no CPU or memory anomaly in auth, while observing its latency.
    Agent interpretation · summary
    The agent treats auth latency as a propagated symptom and shifts suspicion toward payment.
    Reasoning check · reader analysis
    No CPU or memory anomaly does not rule out a delay fault. Nor does it show that auth latency propagated from payment.
  5. The agent switches to payment.

    Available observations
    Payment has the highest-ranked memory anomaly; auth lacks a CPU or memory anomaly. No new L3 ranking is reported here.
    Agent interpretation · summary
    The agent blames payment instead of ts-auth-service.
    Reasoning check · reader analysis
    The revision combines two observations, but neither establishes payment as the cause or rules out auth. A worse-looking metric is not enough.
  6. The root cause was auth, not payment.

    Benchmark label · hindsight
    Root cause entity: ts-auth-service. Injected failure type: delay. This label is available to the reader for the audit, not to the diagnosing agent.
    Decision versus ground truth · hindsight
    The agent's payment diagnosis is incorrect. In this case, the original L3 recommendation matched the true faulty service.
    Reasoning check · reader analysis
    Do not conclude that L3 should always be trusted. Require fault-relevant evidence that supports a new candidate and distinguishes it from the old one.

Section 5.1 reports this Train Ticket case as a summarized decision failure. The page does not reconstruct unreported API calls, timestamps, numerical scores, or a separate baseline outcome. The reasoning checks explain the inference rather than quote an unavailable raw transcript.

Where does a diagnosis fail?

01 / PROCESS

No valid finish.

The agent exhausts the budget or calls an interface without meeting its input requirements.

02 / COVERAGE

The cause never enters.

The investigation does not consider the true root cause.

03 / DECISION

Considered, not chosen.

The agent rejects the correct candidate or confirms an incorrect one.

04 / NAMING

Right entity, wrong type.

A prominent symptom is mistaken for the injected fault.

Section 5.1. For Qwen3.7-Plus with L2 or L3, the true cause was considered in 84–95% of trajectories that nevertheless ended with an incorrect localization. That percentage is conditional on localization failures.

02 / COMPOSITION · RQ1

Does more help?

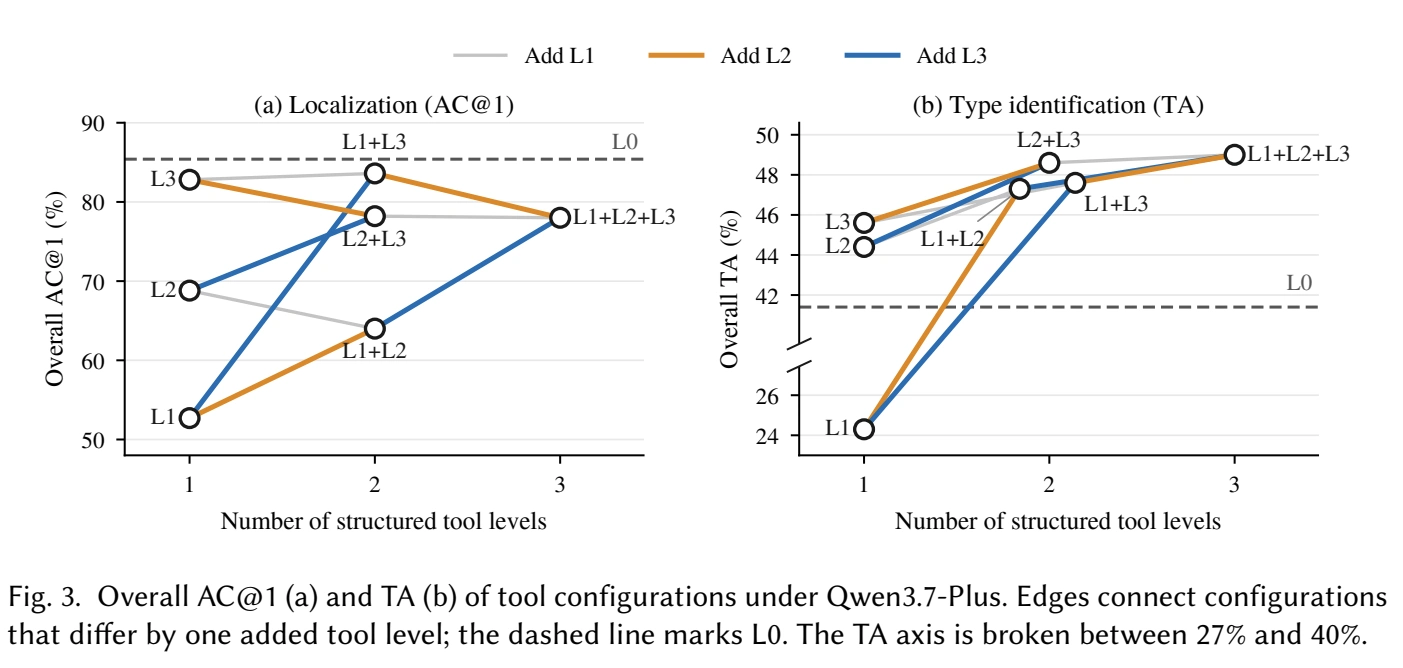
A larger toolset can improve fault typing while hurting localization.

L1 Metric accessL2 Evidence analysisL3 Diagnostic methodsFull tool spectrum

REPRESENTATIVE COMPARISON / QWEN3.7-PLUS · L3 → L1+L2+L3

First-choice root cause accuracy falls from 82.8% to 78.0%; fault type accuracy rises from 45.6% to 49.0%; total tokens rise to 4.17×.

Design implication: decide which diagnostic target matters before adding tools. The same addition can help one target, hurt another, and cost more.

Measured across the three RE1 systems with Qwen3.7-Plus, not a universal ranking of toolsets.

Reference
Compare with

Qwen3.7-Plus · all systems

Localization · AC@1−4.8 pp

82.8% → 78.0%

Failure typing · TA+3.4 pp

45.6% → 49.0%

Total tokens4.17×

22.8K → 95.1K per case

Root cause localization

AC@1: first-choice root cause correct (%)

Failure type identification

TA: predicted fault type correct (%)

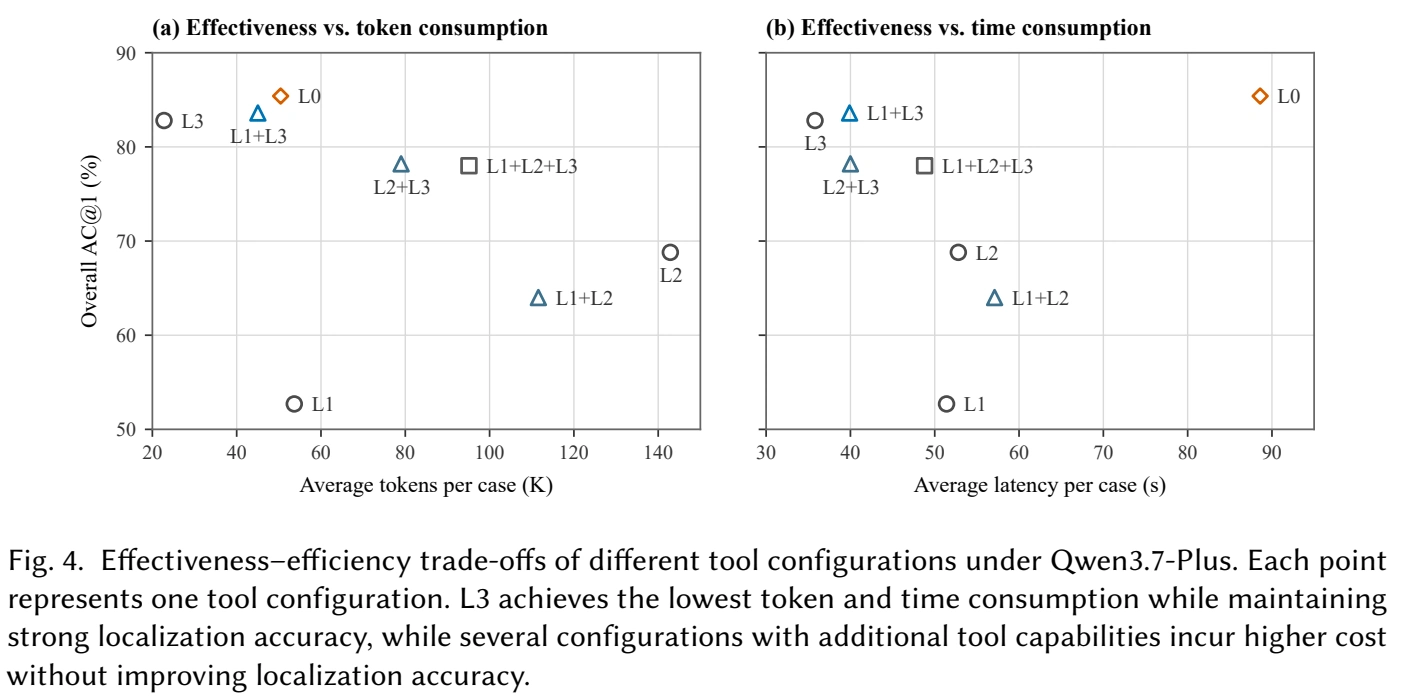
The resource tradeoff

ReferenceComparison

Mean token usage and latency per case. Accuracy appears in the plots above; this view does not rank configurations by a single score.

Table 3. Accuracy uses a fixed 0–100% scale. pp = percentage points; token ratios compare total input + output tokens. The full toolset improves TA over L3 but lowers top-1 localization in this setting.

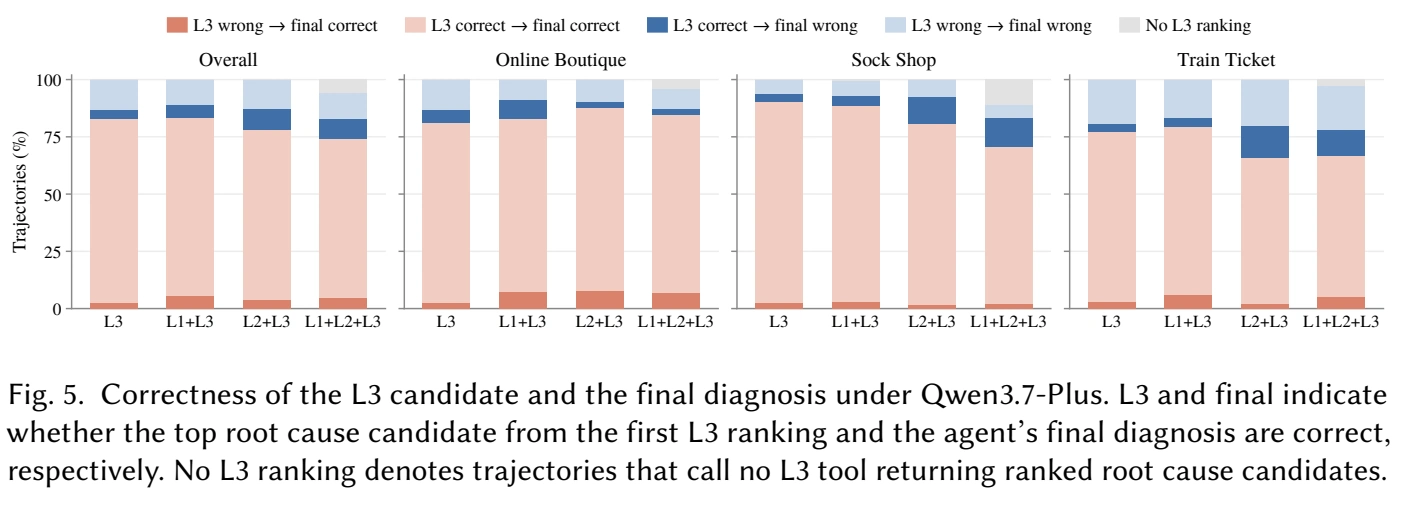
WHAT CHANGES AFTER THE TOOL RETURNS?

The recommendation is stable. The decision is not.

The first L3 candidate is unchanged in 99.9% of paired trajectories that both obtain a ranking. Additional interfaces change whether the agent keeps that candidate. With L2+L3, correct-to-wrong overrides rise to 9.3% of trajectories, while wrong-to-correct revisions are 3.8%.

Inspect a reported decision failure
Complete results · Table 3
Qwen3.7-Plus · mean efficiency per case
ConfigurationAC@1 (%)AC@3 (%)Avg@5 (%)TA (%)Tokens (K)Latency (s)Cost (USD)
L085.493.692.741.450.488.60.019
L152.770.069.124.353.751.40.018
L268.892.387.544.4142.952.80.044
L382.896.293.745.622.835.80.008
L1+L264.088.484.447.3111.657.10.035
L1+L383.694.392.547.645.039.90.015
L2+L378.295.692.348.679.040.00.025
L1+L2+L378.094.892.149.095.148.80.03
Original composition, efficiency, and candidate-decision figures
Original configuration comparisons for localization and type identification; the type accuracy axis is broken.
Figure 3 · Tool composition. Full resolution
Original localization accuracy versus token and latency plots.
Figure 4 · Effectiveness and efficiency. Full resolution
Original correctness of L3 candidates and final diagnoses, including trajectories without a ranking.
Figure 5 · Candidate decisions. Full resolution

03 / MODEL CAPABILITY · RQ2

Available is not
the same as useful.

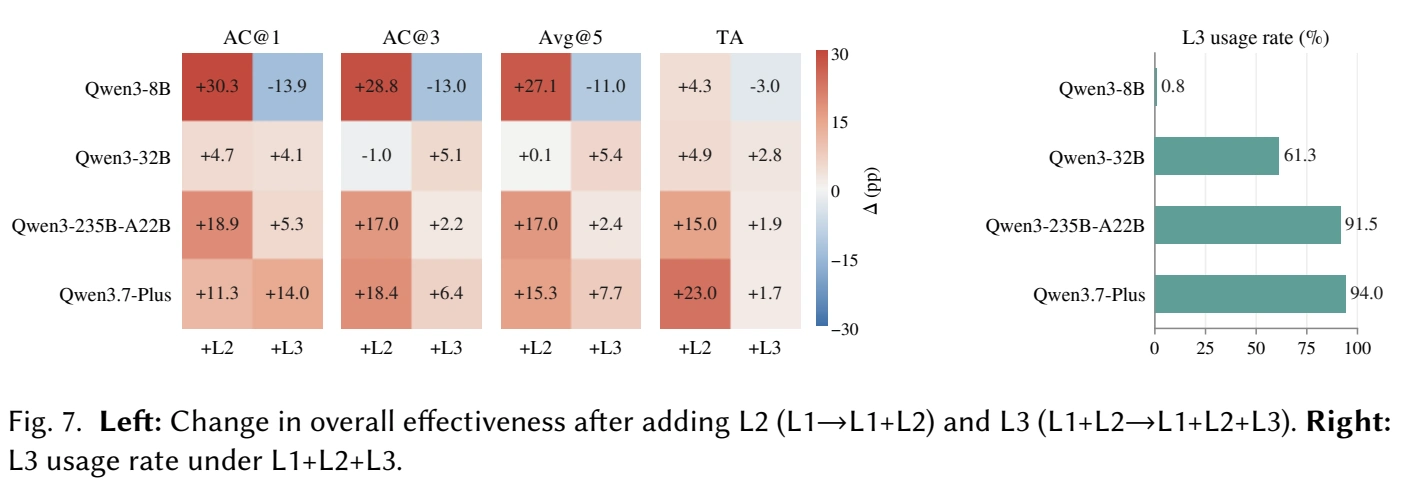
A tool must be selected, called successfully, and assessed correctly.

REPRESENTATIVE COMPARISON / ADD L3 TO L1+L2

Qwen3-8B
-13.9 pp
Qwen3-32B
+4.1 pp
Qwen3-235B-A22B
+5.3 pp
Qwen3.7-Plus
+14.0 pp

The difference is not just whether L3 is present. Qwen3-8B invokes it in only 0.8% of trajectories. Other models lose useful recommendations during calls or final assessment.

Changes in first-choice root cause accuracy across the tested configurations. These four models are not a calibrated capability scale; parameter count alone does not explain the differences.

Root cause localization

AC@1 (%) · four shared configurations

Failure type identification

TA (%) · four shared configurations
L3 invocation rate0.8%

At least one L3 call under L1+L2+L3; not the share receiving a ranking. Figure 7.

L3 is available, but almost never called. The larger action space accompanies longer trajectories and more invalid actions; this is not evidence that incorrect L3 outputs mislead the model.

Qwen3-8B · complete results
Table 4 · Qwen3-8B
ConfigurationAC@1 (%)AC@3 (%)Avg@5 (%)TA (%)Completion (%)Tokens (K)Latency (s)Cost (USD)
L014.832.731.417.577.780.983.40.007
L129.348.447.124.496.463.041.80.005
L1+L259.677.274.228.798.890.746.50.007
L1+L2+L345.764.263.225.797.6122.853.70.009

The model calls L3 but overrides roughly one third of its correct recommendations. Tool availability, correct use, and sound assessment are separate requirements.

Qwen3-32B · complete results
Table 4 · Qwen3-32B
ConfigurationAC@1 (%)AC@3 (%)Avg@5 (%)TA (%)Completion (%)Tokens (K)Latency (s)Cost (USD)
L039.657.656.124.494.053.575.30.018
L145.268.364.423.493.168.643.20.022
L1+L249.967.364.528.386.8160.562.00.049
L1+L2+L354.072.469.931.187.7193.866.20.059

Most trajectories invoke L3, but only about half obtain a ranking. Narrowing the incident window can discard useful evidence; invoking a tool does not guarantee a useful result.

Qwen3-235B-A22B · complete results
Table 4 · Qwen3-235B-A22B
ConfigurationAC@1 (%)AC@3 (%)Avg@5 (%)TA (%)Completion (%)Tokens (K)Latency (s)Cost (USD)
L035.658.656.023.598.848.963.40.017
L145.066.863.724.397.547.240.50.015
L1+L263.983.880.739.398.878.238.80.024
L1+L2+L369.286.083.141.299.487.337.60.027

This model performs its strongest top-1 localization with its own Python analysis. Additional tools can improve failure typing, while candidate revisions remain a source of localization errors.

Qwen3.7-Plus · complete results
Table 4 · Qwen3.7-Plus
ConfigurationAC@1 (%)AC@3 (%)Avg@5 (%)TA (%)Completion (%)Tokens (K)Latency (s)Cost (USD)
L085.493.692.741.4100.050.488.60.019
L152.770.069.124.3100.053.751.40.018
L1+L264.088.484.447.3100.0111.657.10.035
L1+L2+L378.094.892.149.0100.095.148.80.03
01 / SELECT

Delegate the right analysis.

Does the agent choose the interface that can help?

02 / CALL

Supply valid inputs.

Does the call return relevant evidence or a ranking?

03 / ASSESS

Use the result responsibly.

Does the agent keep or revise a candidate for a sound reason?

Findings 5–7. The model categories are not a calibrated capability scale. Only Qwen3.7-Plus was tested under all eight configurations; the plots here show the four common configurations.

Original model effects and L3 usage
Original changes after adding L2 and L3, and L3 usage rates across four models.
Figure 7 · Model effects and L3 use. Full resolution

04 / SYSTEM ENVIRONMENT · RQ3

Same addition.
Different consequences.

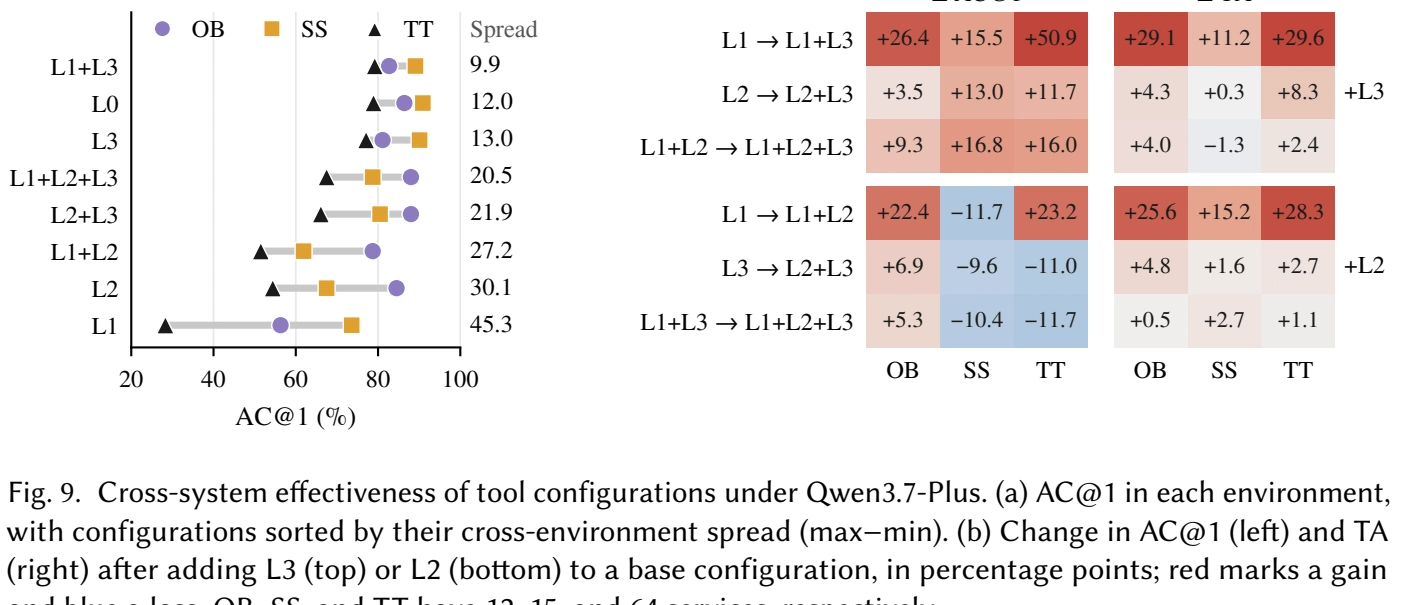
A tool addition can help one system and hurt another.

REPRESENTATIVE COMPARISON / QWEN3.7-PLUS · L3 → L2+L3

Online Boutique
+6.9 pp
Sock Shop
-9.6 pp
Train Ticket
-11.0 pp

Observed: first-choice root cause accuracy improves in Online Boutique but falls in the other two systems. Trace analysis points to different outcomes when agents switch to an anomalous entity.

Not established: that service count causes the reversal. Topology, communication, and metric composition also differ. Revalidate the configuration in the target environment.

Qwen3.7-Plus · Table 5
OB

Online Boutique

Localization +6.9 pp

Failure typing +4.8 pp

SS

Sock Shop

Localization −9.6 pp

Failure typing +1.6 pp

TT

Train Ticket

Localization −11.0 pp

Failure typing +2.7 pp

Changes are percentage points, not relative percentages. All nine possible one-level additions among the seven structured configurations are available. Environment properties vary jointly; the results do not establish a causal effect of service count alone.

What do candidate switches reveal?

Online Boutique

When an agent switches from an L3 candidate to a different entity ranked highest by L2, the switch is correct in 79% of those cases.

Sock Shop

In the same conditional analysis, switches to a different L2-ranked entity are correct in only 5% of cases.

Train Ticket

Switches to a different L2-ranked entity are correct in only 5% of cases. Service count alone does not explain this contrast.

The percentages above are conditional on an agent switching from an L3 candidate to a different entity ranked most anomalous by L2. They are not overall tool accuracy. The manuscript does not state the corresponding sample counts; these proportions alone do not establish their uncertainty or a causal explanation.

Complete cross-system results · Table 5
Qwen3.7-Plus · all values in percent
ConfigurationOnline BoutiqueSock ShopTrain Ticket
AC@1AC@3Avg@5TAAC@1AC@3Avg@5TAAC@1AC@3Avg@5TA
L086.495.294.045.990.996.395.941.678.989.388.236.8
L156.376.073.723.273.687.586.528.828.346.747.120.8
L284.595.293.250.167.598.492.040.854.483.277.242.1
L381.196.093.549.690.1100.097.839.577.192.589.847.7
L1+L278.791.589.248.861.996.890.144.051.576.873.849.1
L1+L382.793.692.052.389.198.196.040.079.291.289.450.4
L2+L388.097.195.654.480.599.295.041.166.190.486.250.4
L1+L2+L388.096.395.252.878.798.994.842.767.589.386.151.5
Original cross-system figure
Original per-system localization comparisons and marginal changes after adding tool levels.
Figure 9 · Cross-system effects. Full resolution

05 / FROM EVIDENCE TO DESIGN

Principles & guidelines.

Choose tools for the decision they support, not the size of the toolset.

Practical checks derived from this study, not separately validated improvements. Use the linked evidence to decide what to test next.

  1. 01

    Separate the two diagnostic targets.

    When
    A tool addition helps one accuracy metric but hurts another.
    Check
    Compare first-choice root cause accuracy, fault type accuracy, and cost separately.
    Try
    Choose the target you need to improve before selecting a configuration; report the tradeoff rather than a single winner.
    Accuracy and cost tradeoff
  2. 02

    Match tools to demonstrated capability.

    When
    Tools are available, but the agent gains little from them.
    Check
    Measure selection, valid calls, useful returned results, and whether correct recommendations survive the final decision.
    Try
    Simplify the failing interface or its instructions; evaluate result assessment separately from tool invocation.
    Selection, calls, assessment
  3. 03

    Make candidate revisions accountable.

    When
    New observations cause the agent to replace a diagnostic candidate.
    Check
    Record the old candidate, new candidate, and evidence supporting the change or contradicting the old explanation.
    Try
    Ask for fault-relevant evidence before a switch; do not equate the most anomalous metric with the root cause.
    Reported decision failure
  4. 04

    Distinguish the fault from its symptoms.

    When
    The entity is right, but the predicted fault type is wrong.
    Check
    Look for evidence that separates competing fault types, rather than only the most prominent CPU or latency symptom.
    Try
    Expose fault-specific observations and ask the agent to compare alternative explanations.
    Right entity, wrong type
  5. 05

    Revalidate when the system changes.

    When
    A configuration is moved to a different microservice environment.
    Check
    Re-evaluate accuracy and whether anomaly rankings align with labeled root causes in that environment.
    Try
    Validate the configuration locally before transferring its ranking from another system.
    Cross-system reversal
  6. 06

    Repair the stage that actually fails.

    When
    Diagnosis fails, despite adding more tools or evidence.
    Check
    Classify the failure: invalid execution, missing cause, wrong candidate decision, or wrong fault type.
    Try
    Improve interface reliability, evidence coverage, candidate comparison, or fault-specific evidence according to that failure.
    Four failure locations

These are design implications derived from the empirical findings and discussion, not separately evaluated interventions or universal rankings. Their applicability beyond the tested models and metric-based benchmark requires validation.

06 / BACKGROUND · ANALYTICAL RESPONSIBILITY

The tool spectrum.

The levels differ in what tools return, and what the agent must still decide.

SAME INCIDENT DATA
  • Metrics
  • Incident context
  • Service topology
L0

Agent-written analysis

Python interface

Tool work Run agent-written Python. A code editor and a computed time series.

Run agent-written Python

Returned to the agent

Results of the agent's own programs

Agent decision

Choose, implement, and interpret the analysis.

L1

Metric access

6 structured interfaces

Tool work Retrieve and summarize metrics. A selected time window and a basic summary, without anomaly scores or cause rankings.

Retrieve and summarize metrics

Returned to the agent

Samples, summaries, and local topology

Agent decision

Find unusual behavior and reason about its cause.

L2

Evidence analysis

12 structured interfaces

Tool work Detect and connect unusual signals. An anomaly marker on a time series and a graph of related evidence.

Detect and connect unusual signals

Returned to the agent

Anomalies, change points, and evidence links

Agent decision

Connect the evidence. Distinguish symptoms from causes.

L3

Diagnostic methods

6 structured interfaces

Tool work Rank and explain candidates. An ordered candidate list beside its supporting evidence relationships, not a final diagnosis. 123

Rank and explain candidates

Returned to the agent

Candidate rankings and supporting explanations

Agent decision

Assess the recommendation, then keep or revise it.

The agent makes the final diagnosis at every level.Independent interfaces, not a required pipeline. Higher abstraction does not guarantee a better diagnosis.

Agent-written analysis

Python interface
THE TOOL

Execute Python over the same case metrics, incident context, and service topology.

THE AGENT

Choose, implement, and interpret the entire analysis. There are no predefined RCA procedures.

Returned to the agentResults of the agent's own programs
SCHEMATIC EXAMPLE / L0

Agent-written Python · one analysis step

A ticketing request becomes slow. What does each interface give the agent?

  • latency_ms = [20, 22, 140, 150]
  • print(sum(latency_ms) / len(latency_ms))
  • output: 83.0 ms · computed by the agent's code

Even this summary requires agent-written code. The agent implements any further analysis itself; no ready-made RCA procedure is provided.

Schematic outputs, not a recorded benchmark trace. Sample values are illustrative; no measured anomaly score or diagnostic confidence is implied.

Capabilities covered
  • Select and process incident data
  • Compute statistics in agent-written code
  • Implement further analysis
  • Interpret the resulting observations

Metric access

6 structured interfaces
THE TOOL

Retrieve metric samples, summary statistics, metric ownership, and local service dependencies.

THE AGENT

Choose what to inspect, identify unusual behavior, and reason about its cause. These tools do not score anomalies or rank root causes.

Returned to the agentObservations and basic summaries
SCHEMATIC EXAMPLE / L1

Metric query and summary

A ticketing request becomes slow. What does each interface give the agent?

  • service: auth · metric: request latency
  • samples (ms): [20, 22, 140, 150]
  • mean (ms): 83 · maximum (ms): 150

These are measurements and summaries. The interface has not labeled them anomalous or named a root cause.

Schematic outputs, not a recorded benchmark trace. Sample values are illustrative; no measured anomaly score or diagnostic confidence is implied.

Capabilities covered
  • Metric discovery and retrieval
  • Service, metric, and time-window queries
  • Batch metric queries
  • Mean, maximum, minimum, sum, and percentiles
  • Metric ownership resolution
  • Local topology inspection

Evidence analysis

12 structured interfaces
THE TOOL

Analyze time series and return anomaly scores, change points, candidate metrics, temporal features, and evidence graphs.

THE AGENT

Relate evidence across services and decide what it means for diagnosis. The most anomalous metric is not necessarily the root cause.

Returned to the agentAnomaly scores, features, and relationships
SCHEMATIC EXAMPLE / L2

Anomaly and relationship analysis

A ticketing request becomes slow. What does each interface give the agent?

  • auth latency: change detected near the incident
  • payment memory: highest-ranked anomalous metric
  • relationship analysis: related metric evidence

This identifies unusual signals and their relationships. Highest anomaly rank does not mean most likely root cause.

Schematic outputs, not a recorded benchmark trace. Sample values are illustrative; no measured anomaly score or diagnostic confidence is implied.

Capabilities covered
  • Time-series processing and filtering
  • Anomaly detection: 3-sigma, IQR, MAD, ESD, SPOT
  • Change points: CUSUM, PELT, binary segmentation, Page–Hinkley
  • Temporal feature extraction
  • Anomalous metric filtering
  • Relationship analysis and evidence graphs

Diagnostic methods

6 structured interfaces
THE TOOL

Generate candidate rankings, combine diagnostic evidence, and assemble explanations for specified candidates.

THE AGENT

Assess whether to keep or revise the recommendations, then submit the final candidate list and failure type.

Returned to the agentRanked candidates and diagnostic explanations
SCHEMATIC EXAMPLE / L3

Diagnostic ranking and explanation

A ticketing request becomes slow. What does each interface give the agent?

  • root cause candidates: 1. auth · 2. payment
  • support: latency evidence and service relationships
  • agent still submits the final entity and fault type

This is a diagnostic recommendation, not the final answer. The agent must assess the support before keeping or revising it.

Schematic outputs, not a recorded benchmark trace. Sample values are illustrative; no measured anomaly score or diagnostic confidence is implied.

Capabilities covered
  • Propagation-path analysis
  • Graph ranking: PageRank, personalized PageRank, random walk with restart
  • Classic RCA: MonitorRank, CloudRanger, MicroRCA, Microscope, MicroCause, MicroHECL
  • Fusion of anomaly, ranking, topology, and timing evidence
  • Supporting evidence chains
  • Diagnostic explanations

Section 3.2. Counts refer to callable interfaces, not the number of algorithms. L2 and L3 access case data directly and perform internal preparation; no prior L1 call or fixed invocation order is required. Final diagnosis remains the agent's responsibility.

07 / BACKGROUND · A CONTROLLED COMPARISON

Change the tools.
Keep the task grounded.

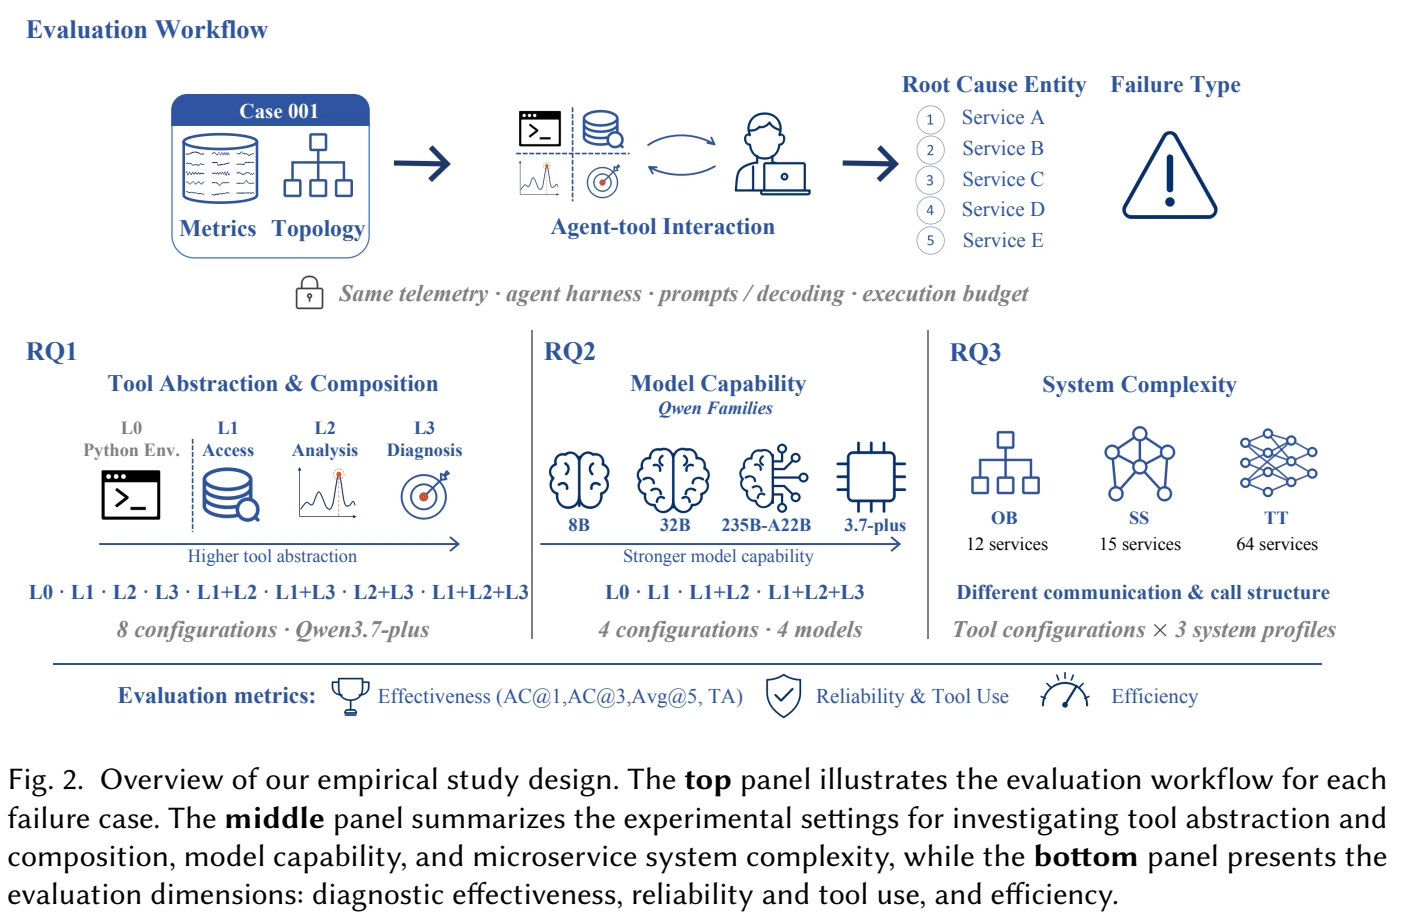
Eight configurations do not mean an eight-by-four model sweep.

Qwen3.7-Plus: all 8 configurations. The other three models: L0, L1, L1+L2, and L1+L2+L3. The 7 structured configurations expose different subsets of L1–L3; L0 is evaluated independently with agent-written Python analysis.

Structured interfacesTools
24
ConfigurationsConfigs
8
Models
4
Systems
3
Failure casesCases
375

Held in common

  • Case metrics, incident context, and topology
  • ReAct agent harness and shared task prompt
  • Interaction budget and per-response output limits
  • Ranked root causes and a predicted failure type

Varied deliberately

  • Tool abstraction and composition
  • Four models from the Qwen lineage
  • Three microservice environments
  • Interface instructions matched to available tools
What was actually evaluated
ModelL0L1L2L3L1+L2L1+L3L2+L3L1+L2+L3
Qwen3-8B●●——●——●
Qwen3-32B●●——●——●
Qwen3-235B-A22B●●——●——●
Qwen3.7-Plus●●●●●●●●
OB / 125 CASES

Online Boutique

12 services · 49–59 metrics per case

gRPC service communication.

SS / 125 CASES

Sock Shop

15 services · 57–63 metrics per case

HTTP service communication.

TT / 125 CASES

Train Ticket

64 services · 198–238 metrics per case

Synchronous and asynchronous communication with complex call chains.

Metrics and study boundaries
AC@1 / AC@3
Whether the true root cause entity is in the top one / three candidates.
Avg@5
The mean of AC@1 through AC@5.
Type Accuracy (TA)
Whether the predicted failure type matches the injected fault.
Completion
A valid diagnosis submitted within the interaction budget.
L3 usage
A trajectory invokes at least one L3 tool; this does not imply it receives a candidate ranking.
Efficiency
Mean total input + output tokens, elapsed seconds, and API cost per case.

All accuracy denominators include cases without valid diagnoses. The study uses all 375 RCAEval RE1 cases and five injected fault types: CPU, memory, disk, delay, and packet loss. It studies metrics and four models from one lineage, not production incidents, logs, traces, or other model families.

Comparison conditions and statistical reporting
Coverage Reported
Seven structured configurations plus an independent L0 reference. Qwen3.7-Plus is tested under all eight; the other three models under L0, L1, L1+L2, and L1+L2+L3.
Data and execution conditions Reported
The configurations share case data, the agent harness, the task prompt, and execution limits. Available structured interfaces and their instructions change. Shared data does not imply identical available actions.
Python access and environment Not specified in this manuscript
L0 explicitly exposes a general Python execution interface. The manuscript does not explicitly say whether structured configurations also expose it, or list the sandbox restrictions and installed dependencies.
Accuracy and efficiency aggregation Reported
Accuracy covers all evaluated cases, including invalid or missing diagnoses. Token usage includes input and output across all LLM calls; token, latency, and API cost are averaged over all evaluated cases.
Repeated runs and uncertainty Not specified in this manuscript
Repeat counts, random seeds, and uncertainty intervals are not stated. Small differences should not be read as statistically established improvements.
Conditional switching analysis Partially reported
The 79% / 5% / 5% comparison concerns switches from an L3 candidate to a different entity ranked most anomalous by L2. The corresponding sample counts are not stated; these percentages are not overall tool accuracy.

These notes describe what the public paper reports. Missing details are not inferred from rounded percentages.

Original study design
Original study workflow, tool configurations, model comparison, and system profiles.
Figure 2 · Study design. Full resolution

08 / THE RESEARCH QUESTION

Abstract.

Rethinking Tool Design for Agentic RCA: A Controlled Empirical Study

A study of tool choices, not another RCA framework.

Existing RCA agents often use fixed preprocessing or predefined tools, leaving little experimental guidance on how much analysis tools should do. We define a tool spectrum, compare configurations under shared task and execution conditions, and inspect the decisions that follow tool calls. The contribution is evidence for tool design: what improves, what gets worse, and where useful tool results are lost.

Read the full abstract

Large language model (LLM) agents are increasingly explored for root cause analysis (RCA) in microservice systems, yet empirical guidance on how to design and combine their tools remains limited. We conduct a controlled empirical study of tool abstraction and composition across models and microservice environments. We implement 24 structured tools for metric access (L1), evidence analysis (L2), and diagnosis (L3), alongside a Python-based reference setting (L0). Using 375 failure cases from three microservice systems, we evaluate eight configurations with Qwen3.7-Plus and compare four Qwen models on a shared subset of four configurations. Our results show that tool configurations affect root cause localization and failure type identification differently. With Qwen3.7-Plus, L3 achieves 82.8% top-1 localization accuracy compared with 85.4% for L0, while requiring less than half the time per case. Adding tool levels can improve type identification while reducing localization accuracy. Trajectory analysis reveals cases in which agents override correct diagnostic recommendations after consulting additional evidence. Model choice also changes tool benefits: adding L3 to L1+L2 improves diagnosis for three models but hurts Qwen3-8B, which rarely invokes L3. Tool configuration rankings further change across microservice systems. These findings provide an empirical foundation for designing and using RCA tools, guiding tool selection and composition according to the model, diagnostic objective, and target system.

09 / CITE THIS WORK

BibTeX.

@misc{luo2026rethinkingtooldesignagentic,
  title={Rethinking Tool Design for Agentic RCA: A Controlled Empirical Study},
  author={Yu Luo and Rongchen Gao and Zhenhui Zhou and Changchang Liu and Yuliang You and Yongqian Sun and Shenglin Zhang and Qiuai Fu and Shijie Wang and Dan Pei},
  year={2026},
  eprint={2610.05009},
  archivePrefix={arXiv},
  primaryClass={cs.SE},
  url={https://arxiv.org/abs/2610.05009}
}