Start with the symptom, not a verdict Observe
Checkout starts returning 503s eight minutes after order-service v2.8 is deployed.
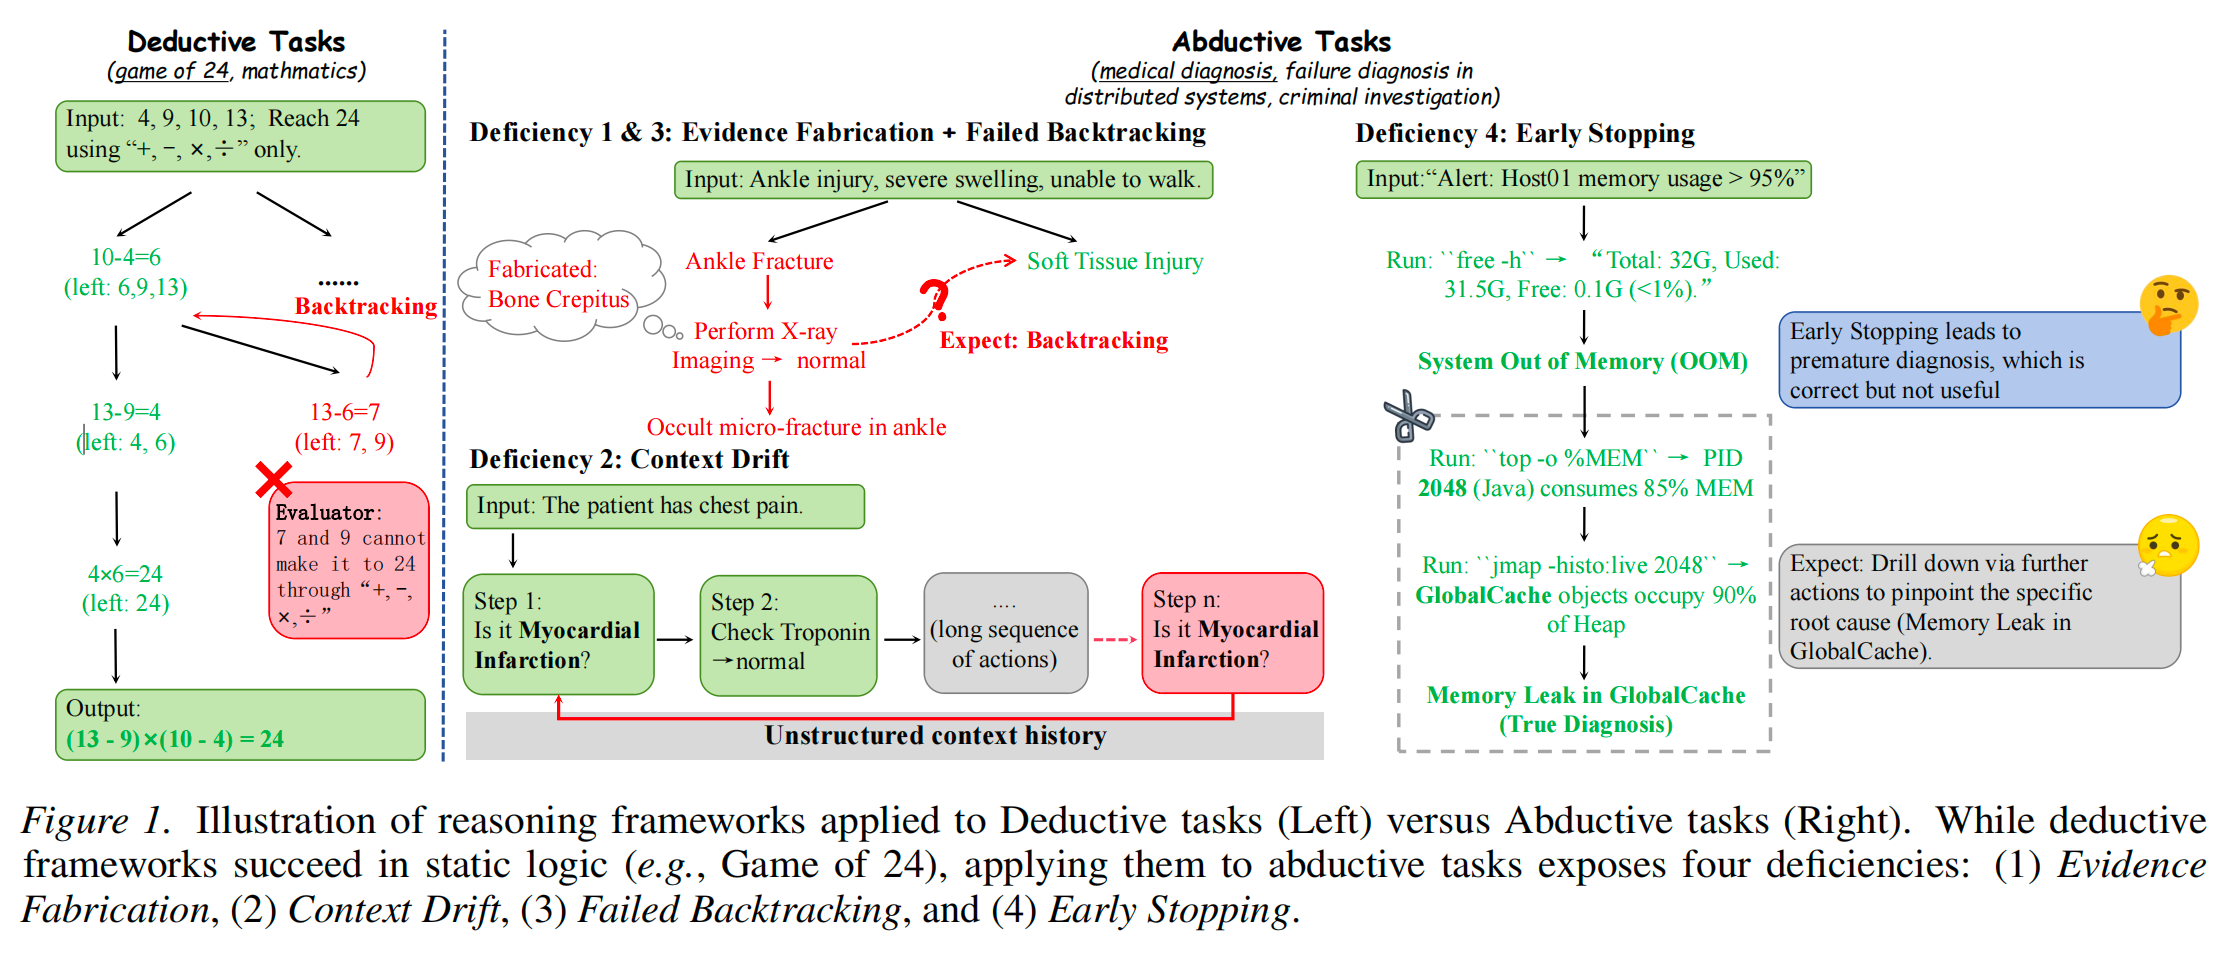
Record the symptom and time window. A nearby deployment is a lead to investigate, not enough evidence to blame the release.
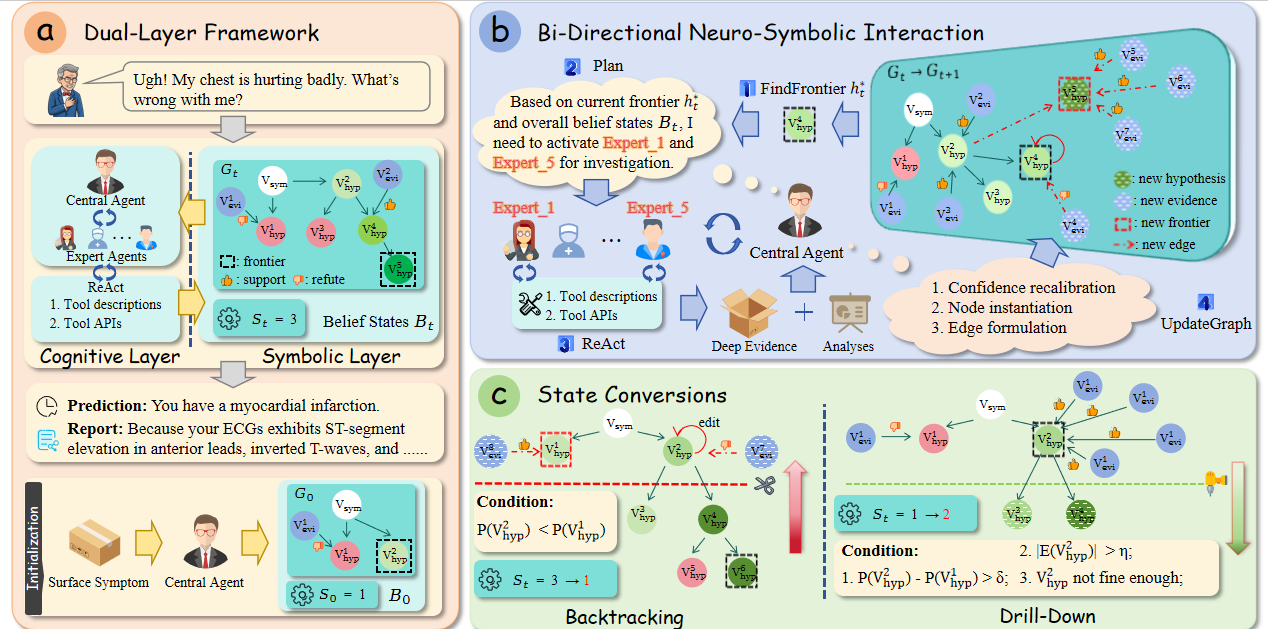
Keep three explanations open Hypothesize
Checkout depends on order-service, the database, and payment. Each could explain a slow or failed request.
Create competing hypotheses in one belief state. Start with database overload, but retain payment and order-service as alternatives.
A database wait is only a clue Collect evidence
An application trace shows a two-second wait to borrow a database connection.
Attach this observation to both plausible explanations. It may mean a busy database or a problem with the application's own pool; do not treat it as proof of either.
Look beneath database overload Drill down
The leading hypothesis is still broad: what would make the database slow?
Refine it into slow SQL and lock contention. Ask for database-side measurements that can distinguish these explanations.
Fast SQL weakens the first branch Collect evidence
SQL latency is normal: 18 ms at p95. The long application wait happens before a query starts.
Connect the measurement to slow SQL with a refuting edge. Keep that branch in the graph and test lock contention next.
The second database branch also fails Collect evidence
There are no blocked sessions, and database CPU is low throughout the failure window.
Lower belief in both lock contention and database overload. Neither refined explanation fits the evidence; continuing here would repeat a dead end.
Backtrack to a different explanation Backtrack
Both children of database overload have been weakened by direct measurements.
Move from depth 2 back to depth 1 and select order-service. Preserve the rejected hypotheses and their evidence so later reasoning does not start the same investigation again.
Locate the wait inside order-service Collect evidence
Payment latency is normal. The trace places the delay inside order-service's connection-acquisition span.
Refute payment slowdown and strengthen the order-service branch. The focus now follows measured request timing, not the initial guess.
Separate pool pressure from CPU pressure Drill down
The fault is local to order-service, but that still does not explain what is failing.
Add pool exhaustion and CPU pressure as depth-2 hypotheses. Request pool counters and runtime measurements rather than choosing a cause by name.
Confirm the immediate bottleneck Collect evidence
All 80 connections are checked out. New requests queue, although many database sessions are idle.
Support pool exhaustion with the observed counters. Distinguish the bottleneck from its cause: a full pool does not yet explain why connections remain borrowed.
Rule out a busy runtime Collect evidence
CPU usage is 32% and event-loop lag is 4 ms, both within the healthy range.
Mark CPU pressure as unsupported. Keep the pool as the current focus, with the alternative and its refuting evidence still visible.
Why is the pool full? Drill down
Pool exhaustion could reflect too little capacity or connections that are never returned.
Refine the pool hypothesis into two depth-3 explanations. Test the simpler capacity explanation first, without discarding a possible leak.
A workload comparison rejects the easy fix Collect evidence
Traffic and pool size are unchanged. Under the same load, the previous release peaked at 35 of 80 borrowed connections.
Lower belief in an undersized pool. Increasing capacity might delay the failure, but the comparison points to changed connection handling instead.
Backtrack instead of adding capacity Backtrack
The capacity branch does not explain why the same workload worked before the release.
Return from depth 3 to the depth-2 pool hypothesis. Reconsider its remaining child, using the stored comparison rather than restarting the whole diagnosis.
Follow the remaining pool explanation Drill down
A connection leak could explain an ever-full pool alongside mostly idle database sessions.
Select the existing leak hypothesis. Ask whether each successful borrow has a matching return, especially on failed or canceled requests.
Connect the leak to canceled requests Collect evidence
Only v2.8 shows a growing borrow/return gap after canceled requests. The old release does not under the same test.
Attach this evidence to the leak hypothesis. It narrows the search to cancellation handling, but a matching code path and reproduction are still needed.
Find the missing cleanup path Drill down
The new cancellation branch can return after borrowing a connection, before connection.release() runs.
Create a depth-4 hypothesis: cancellation skips cleanup. Link the code observation to it, then test that path before declaring a root cause.
Reproduce the suspected mechanism Verify
In isolation, 20 requests canceled after acquisition leave exactly 20 connections checked out.
The controlled reproduction links this path to retained connections. This is stronger than the earlier correlation between deployment time and failures.
Test a targeted repair Verify
A finally block guarantees release. The same 20 cancellations now retain zero connections; a matched-load canary recovers.
Use the repair as another check of the explanation. The change removes the proposed mechanism and the observed bottleneck without enlarging the pool.
Report a cause, not just a symptom Resolve
Canceled requests bypass cleanup in v2.8, leaking connections until the order-service pool is exhausted and checkout returns 503s.
Report the evidence-backed path and the verified fix: release the connection in finally. The graph retains the alternatives, two backtracks, and the observations behind the conclusion.